View a Resource's Load Chart
The Work Planner Load Chart can display the total workload of a Resource across all Projects in Eclipse PPM. It creates a visual of the Resource's effort over time, which allows Project Managers to see if the Resource can take on additional work before using the Work Planner to assign it.
Note: The Load Chart can be opened from either the Resource Sheet or the Task Sheet.
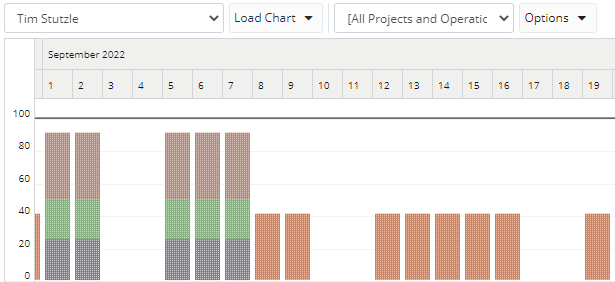
In the example above, Tim's Load Chart is being viewed from the Resource Sheet. We can see that his assignments between September 1st to September 7th (excluding the weekend) are at approximately 90% of his FTE (full-time equivalent). The black horizontal line at the "100" mark represents his full capacity (100% of his FTE). We can also see that he has assignments on multiple Projects because the different colors represent other Projects and Operations.
 = Current Project assignments
 = Other Project assignments
 = Other Operation assignments
Viewing Tim's Load Chart from the Task Sheet will provide a different perspective:
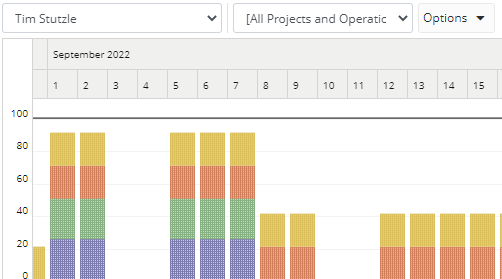
This Load Chart is based on Tim's role on the selected Task in the Task Sheet. The colors are represented as follows:
 = Current Task assignments
 = Other assignments on the current Project
 = Other Project assignments
 = Other Operation assignments
Note: The date range of the Load Chart will always reflect the Start and End dates of the Work Plan. Any Resource assignments that have been made outside this range will not appear in the Load Chart, even if they have been made to the current Work Plan.
Note: Certain entities (the current Project or other Projects / Operations) can be filtered out of the Load Chart. See Configuring the Load Chart below for more information.
Tip: You can view a breakdown of the Resource's work by clicking on any of the bars in the Load Chart:
The arrows in the top left-hand corner of the window can be used to navigate to the previous or next bar in the chart.
This page covers the following topics:
Accessing a Resource's Load Chart
The Load Chart can be accessed from two locations on the Work Planner: the Resource Sheet and the Task Sheet.
To access a Resource's Load Chart from the Resource Sheet:
-
Navigate to a Project.
-
Select the Open Work Planner button in the top right-hand corner of the screen:

Note: This will open the Work Planner in a separate browser tab.
-
Select the arrow button in the bottom left-hand corner of the screen to open the bottom window (if it is not open already):

-
Ensure that the Resource Sheet tab is selected.
-
Use the "Select a Resource" drop-down menu from the window to the right of the Resource Sheet load a Resource into the window:

-
Select Load Chart from the drop-down menu labeled "Task List":
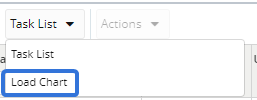
Selecting Load Chart will open it up in the window:

To access a Resource's Load Chart from the Task Sheet:
-
Navigate to a Project.
-
Select the Open Work Planner button in the top right-hand corner of the screen:

Note: This will open the Work Planner in a separate browser tab.
-
Select the arrow button in the bottom left-hand corner of the screen to open the bottom window (if it is not open already):

-
Select the Task Sheet tab:

-
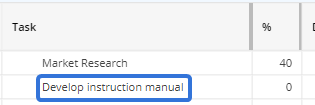
Load a Task into the Task Sheet by typing the name of the Task into the "Select a Task by typing here" field and selecting it:
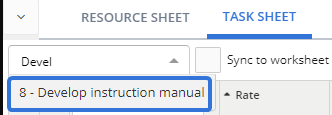
Note: If the "Sync to worksheet" checkbox is selected, you will not be able to do this. Instead, select a Task from the worksheet directly above:
-
Use the "Select a Resource" drop-down menu on the window to the right of the Task Sheet to load a Resource into the window:

Note: Only Resources that are assigned to the selected Task can be selected from this menu.
After a Resource is selected, the Load Chart will appear in the window:

Configuring the Load Chart
Eclipse PPM users can change the settings of the Load Chart to their liking. They can do this using the "Filter" and "Options" drop-down menus:

Filters
Use the "Filter" drop-down menu to apply a Project filter to the Load Chart. When applied, the Load Chart will only display assignments on Projects that fit the selected filter:
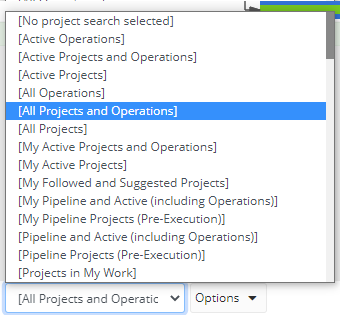
Note: These are the same filters that can be accessed while conducting an Advanced Search for Projects. Custom Project search filters will also appear here.
Options
The "Options" drop-down menu allows users to customize how the Load Chart is displayed.
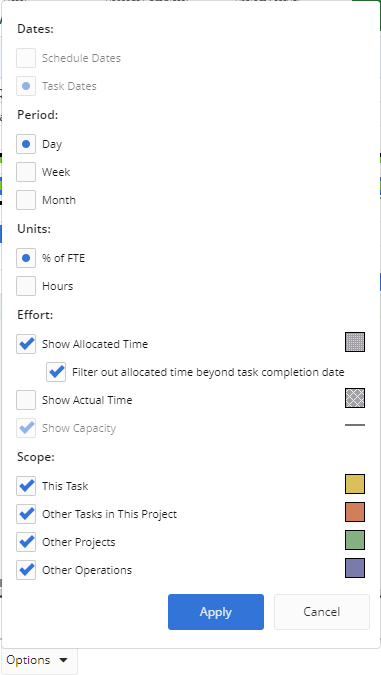
Note: The "Dates" option currently cannot be toggled.
-
Period: Select which time periods will make up the Load Chart: Days, Weeks, or Months.
-
Units: Select which units will be used to measure effort in the Load Chart.
-
% of FTE: The Resource's effort will be measured in % of FTE (fulltime equivalent). Once a bar hits 100 in the Load Chart, the Resource's capacity will be full for the time period (100%).
-
Hours: The Resource's effort will be measured in hours. Once a bar hits the black horizontal capacity bar in the Load Chart, the Resource will have no more working hours in the time period.
Note: The capacity line is dependent on the Calendar attached to the Work Plan.
-
-
Effort: Use the checkboxes to configure how effort will be displayed in the Load Chart.
-
Show Allocated Time: If selected, allocated time will be displayed on the Load Chart. It will be represented by dotted bars:

-
Filter out allocated time beyond task completion date: If selected, allocated time will be filtered out if the allocated time occurs after the end date of the Task.
Note: This option will only be available if the "Show Allocated Time" checkbox is selected.
-
-
Show Actual Time: If selected, actual time will be displayed on the Load Chart. It will be represented by bars with a criss-cross pattern:

Note: The "Show capacity" option currently cannot be toggled.
-
-
Scope: Use the checkboxes to determine which effort is displayed on the Load Chart:
-
This Task: Resource assignments on the selected Task from the Task Sheet will appear on the Load Chart. They will be displayed in yellow.
Note: This option is only available when accessing a Resource's Load Chart through the Task Sheet.
-
Other Tasks in This Project: Resource assignments on Tasks in the current Project (excluding the Task selected in the Task Sheet) will appear on the Load Chart. They will be displayed in orange.
Note: This option is only available when accessing a Resource's Load Chart through the Task Sheet.
-
This Project: Resource assignments on the current Project will appear on the Load Chart. They will be displayed in orange.
Note: This option is only available when accessing a Resource's Load Chart through the Resource Sheet.
-
Other Projects: Resource assignments on other Projects (excluding those marked as "Operations") will appear on the Load Chart. They will be displayed in green.
-
Other Operations: Resource assignments on other Projects that have been marked as "Operations" will appear on the Load Chart. They will be displayed in purple.
Once you have configured the options to your liking, select the Apply button.
-